
Eva L. Dyer and Konrad Kording discuss in a commentary article “Why the simplest explanation isn’t always the best” an essential learning related to the article Phantom oscillations in principal component analysis (also available on BioRXiv)

All these datasets have the same principal components.
(Left) if the data are Gaussian, then PCA is the ideal technique, extracting all the structure that is there.
(Middle) when data are not Gaussian, PCA may “see” dimensions that do not exist, in this case stemming from there being multiple Gaussians. In such a case, relaxing the assumption of orthogonality could allow a model to extract the relevant aspects.
(Right) when data are highly structured but not simple. PCA will not discover the relevant structure, but will see structure that is in a way not even there. Indeed, in this case of a single line graph another technique, such as isomap, would discover that the whole dinosaur is just a single line, or a 1D-manifold embedded in 2D.
Dimensionality reduction simplifies high-dimensional data into a small number of representative patterns. One dimensionality reduction method, principal component analysis (PCA), often selects oscillatory or U-shaped patterns, even when such patterns do not exist in the data.
These oscillatory patterns are a mathematical consequence of the way PCA is computed rather than a unique property of the data.
Two common properties of high-dimensional data can be misinterpreted when visualized in a small number of dimensions and cause oscillatory principal components: smoothness and shifts in time or space. (These two properties implicate almost all neuroscience data). The oscillations produced by PCA (“phantom oscillations”), impact data analysis. Traditional cross-validation does not detect phantom oscillations.
Patterns which emerge from high-dimensional data analysis may not faithfully represent the underlying data.
The principal components describe the data, but depending on the structure of the data, they may not align with the generating factors in data or, alternatively, produce hallucinated structure.
Just as a low-pass filter in Fourier analysis emphasizes the smooth, low-frequency components and simplifies the signal by excluding higher frequencies, PCA similarly discovers an oscillatory basis set when looking for an efficient basis for smooth signals. However, this similarity also highlights a critical interpretive hazard: just as many different signals can share similar low-frequency profiles, diverse datasets can yield similar principal components, complicating the attribution of specific meanings or origins to these components.
When data violates our assumptions of simplicity, we may be susceptible to hallucinations through the kinds of mechanisms …
While perhaps counterintuitive, more complex or expressive models that better align with the data’s true generative structures offer a pathway to greater interpretability. For instance, using convolutional operations introduces shift invariance, enabling the model to recognize patterns irrespective of their position in the input space. This in turn can lead to more meaningful feature extraction and robust prediction.
… what feels intuitive and simple can often mislead: dimensionality reduction optimizes for specific statistical features of the data, and doesn’t always agree with the most intuitive explanation.
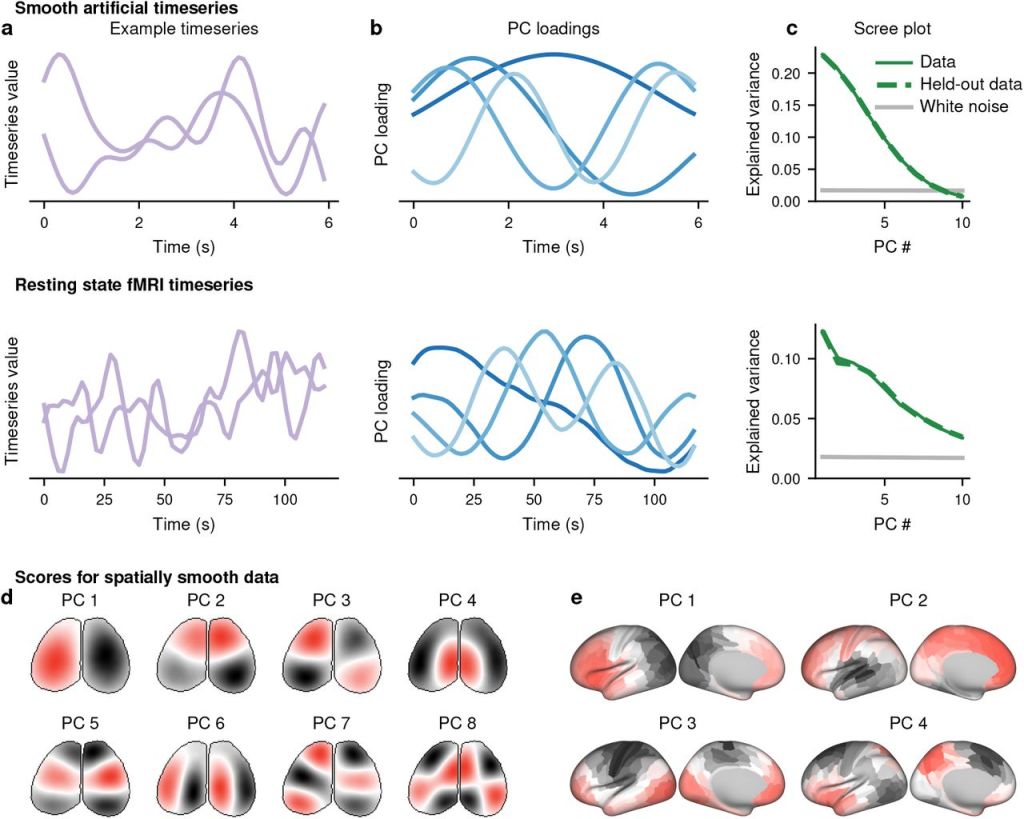
(a) Example timeseries for smooth artificially-generated data (top) and randomly-selected segments from a resting-state fMRI scan (bottom).
(b) Loadings of the first four PCs from large populations of the artificial (top) or fMRI (bottom) data.
(c) Variance explained by the first 10 PCs for the artificial (top) or fMRI (bottom) data. Solid green indicates the data from (a) and (b), and dashed green indicates a second independent sample of the size from the same data. Grey indicates the variance explained by the first 10 PCs of an equally-sized dataset of independent white noise.
(d-e) Artificially-generated white noise was smoothed across the spatial, but not temporal, dimension in the geometry of a widefield image (d) or a parcellated cortical surface (e). PC scores are plotted on these geometries.
So what should we do when faced with complex and real-world behavior? Do we try to find a model with just the right amount of complexity? Look for simpler interpretations within complex models. One radical alternative is to give up on the notion of finding a simple explanation for complex data.
Even with smaller and simpler models, we may see things in the data that aren’t there. In most cases, there may not be a simple way of describing the complexity of the data and models in ways that humans can readily interpret.
… If brain function doesn’t obey a simple set of principles, what can we understand about it, and how can we navigate the balance between faithfulness to the data and the desire to have simple explanations?
