
“Physical activity types, variety, and mortality: results from two prospective cohort studies”
” –> Walking is a great activity, especially when combined 😉 “
During 2 431 318 person years of follow-up, 38 847 deaths were recorded, with 9901 from cardiovascular disease, 10 719 from cancer, and 3159 from respiratory disease. Total physical activity and most individual physical activities, except for swimming, were associated with lower mortality with non-linear dose-response relations.
The pooled multivariable adjusted hazard ratios for all cause mortality in the highest categories of physical activity levels, compared with the lowest, were 0.83 (95% confidence interval 0.80 to 0.85) for walking, 0.89 (0.85 to 0.94) for jogging, 0.87 (0.80 to 0.93) for running, 0.96 (0.93 to 0.99) for bicycling, 1.01 (0.97 to 1.05) for swimming, 0.85 (0.80 to 0.89) for tennis or squash, 0.90 (0.87 to 0.93) for climbing stairs, 0.86 (0.84 to 0.89) for rowing or callisthenics, and 0.87 (0.82 to 0.91) for weight training or resistance exercises.
Higher physical activity variety was associated with lower mortality. After adjustment for total physical activity levels, participants in the group with the highest physical activity variety score (group 5), compared with those in the lowest group (group 1), had a 19% lower all cause mortality and 13-41% lower mortality from cardiovascular disease, cancer, respiratory disease, and other causes (all P for trend <0.001).
Conclusions Habitual engagement in most types of physical activity was associated with lower mortality. The variety of physical activity was inversely associated with mortality, independent of total physical activity levels. Overall, these data support the notion that long term engagement in multiple types of physical activity may help extend the lifespan.
- Most individual physical activities were associated with lower mortality in a non-linear manner
- The variety of physical activity was associated with lower mortality, independent of total physical activity levels
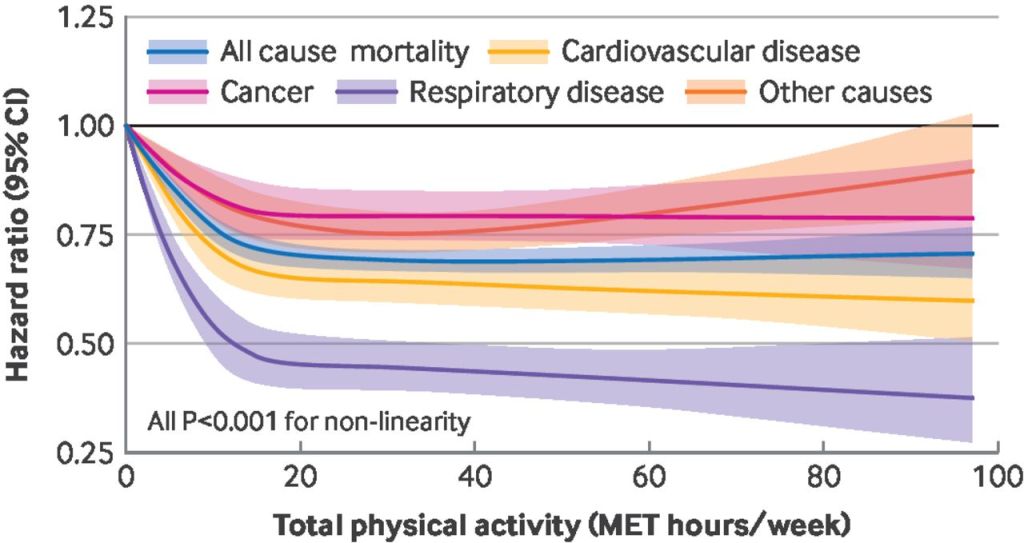
Pooled results from Nurses’ Health Study (1986-2018) and Health Professionals Follow-Up Study (1986-2020).
Data were truncated at the 99th centile value. Models were stratified by age (months), calendar time, and cohort, and were adjusted for ethnic group (white or non-white participants), family history of myocardial infarction or cancer (yes or no), body mass index at baseline, postmenopausal hormone use, smoking status, alcohol intake, total energy intake, modified alternate healthy eating index score, social integration index, and baseline hypertension or hypercholesterolaemia. In the models for respiratory disease mortality, postmenopausal hormone use was coded as ever or never because of the limited number of participants. Raw P values are shown. MET=metabolic equivalent of task
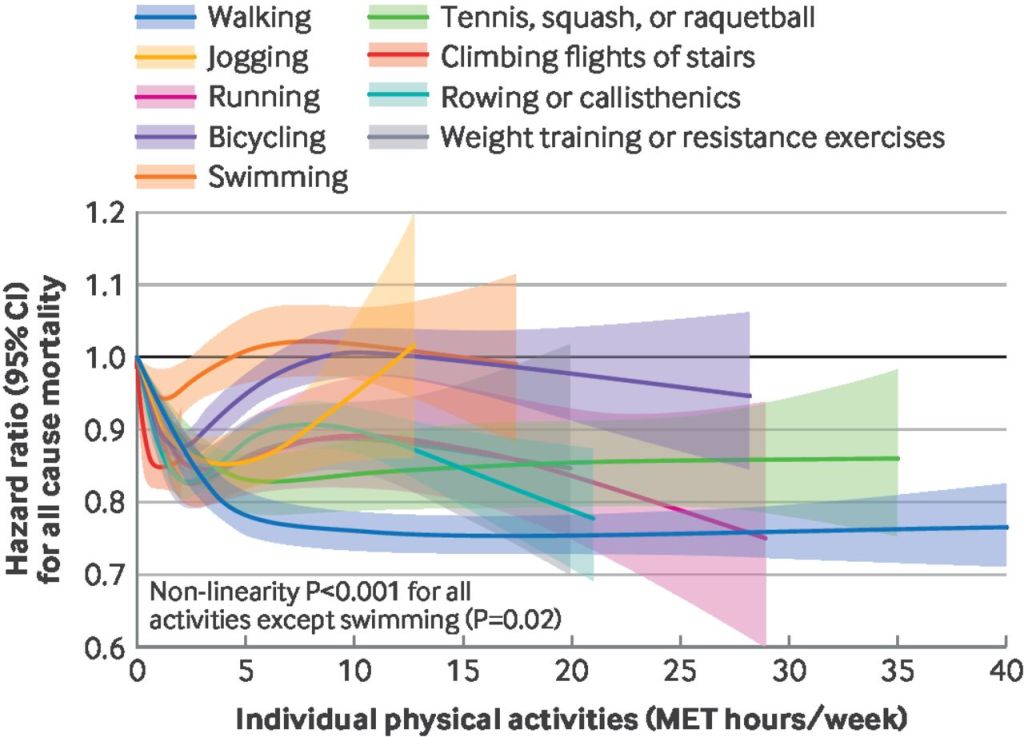
Pooled results from Nurses’ Health Study (1986-2018) and Health Professionals Follow-Up Study (1986-2020), except for weight training (Nurses’ Health Study 2000-18; Health Professionals Follow-Up Study 1990-2020).
For each physical activity type, models were further adjusted for the total level of all other physical activities excluding the specific type being studied (continuous).
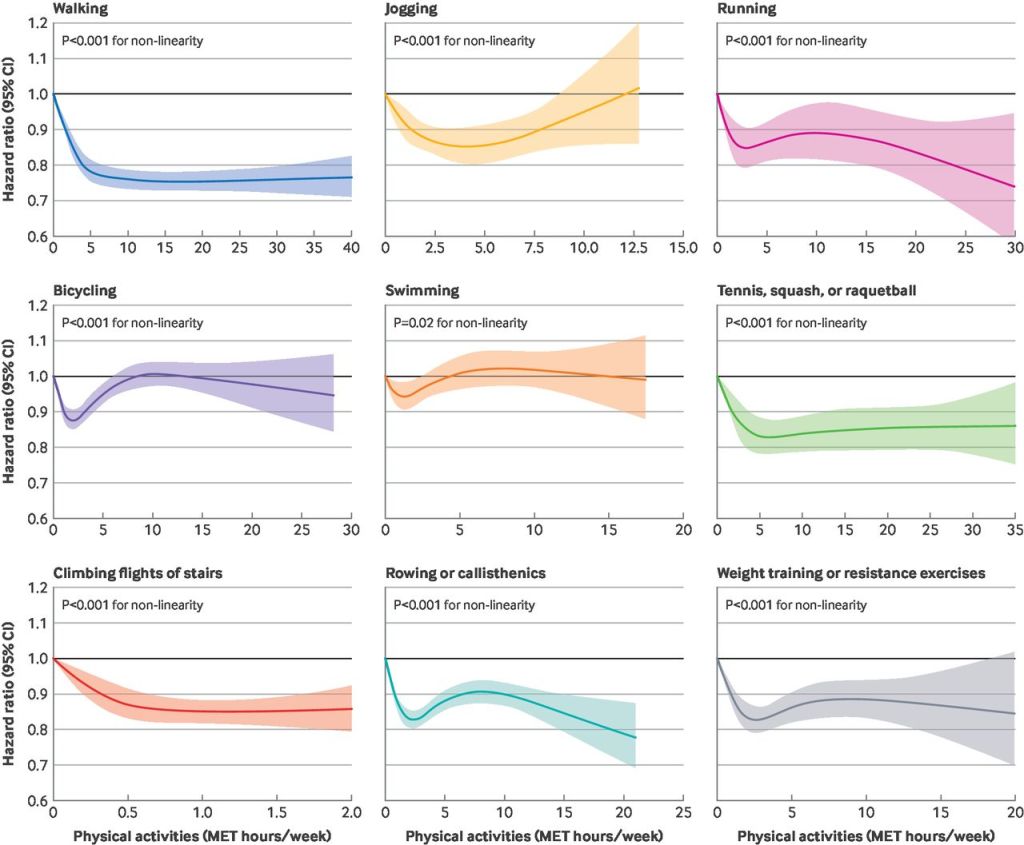
