Traditionally, studies emphasize differences in neural measures between pathological and healthy groups, assuming a binary distinction between the groups, and a linear relationship between neural measures and symptoms.
A continuous relation across the divide of normal and pathological states between neural measures and mental functions shows a relation which can be characterized by a nonlinear inverted-U shaped curve.
Along this curve, mid-range or average expression of a neural measure is associated with optimal function of a mental feature (in healthy states), whereas extreme expression, either high or low, is associated with sub-optimal function, and occurs in different neural disorders.
Neural expression between the optimal or intermediate and pathological or extreme values is associated with sub-optimal function and at risk mental states. Thus, the model of neuro-mental relationship can be summarized as “average is good, extremes are bad”.
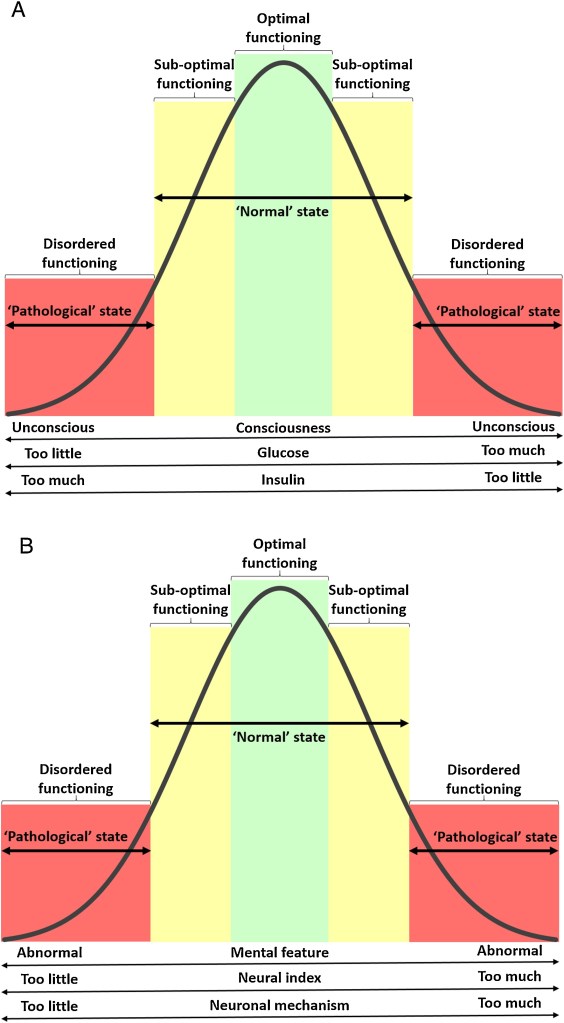
(A): Homeostatic regulation by insulin maintains blood glucose level (in simple terms) in a narrow range (in green) that is optimal for metabolic and mental functioning. Outside this range on both ends (in yellow), the functional state remains normal but the biological state is abnormal and represents a suboptimal or risk state. Further deviations on either end (in red) lead to a dysfunctional states, e.g., clouding of consciousness. Thus, the biological mechanism consists of a continuum with a range of insulin expression that maintains blood glucose homeostasis, which is necessary for optimal metabolic and mental functioning (i.e. consciousness) as manifested in normal behavior.
(B): An inverted U-shaped model relating neural mechanisms to the functionality of mental features. In this model, the focus lies on measuring the expression of a neural mechanism (represented on the x-axis) over a continuous range. A corresponding mental feature that is linked to the said neural mechanism would also show a range of expression. Importantly, the y-axis represents ‘functionality’, i.e. the degree to which the individual is able to function given various degrees of expression of the mental feature. Hence, the degree of functionality associated with the expression of the mental feature corresponds to the degree of the neural measure. The expression of the neural mechanism in the intermediate range (in green) is expected to lead to an expression of the mental feature in a manner that is optimal for mental order or functioning. Expression of the neural measure outside the optimal intermediate range, is expected to be associated with changes in the functionality of the mental feature that are ‘normal’ but fall in a suboptimal zone (in yellow), representing a state of increased risk for mental disorder. Further extremes in the neural measure (in red) are associated with an expression of the mental feature that is dysfunctional and occurs in a ‘pathological state’ as it leads to impairments in behavior.
The relationship between neural and mental features is subject to intense debate. Traditional models assume linear relationship entailing that higher degrees in the expression of a neural mechanism lead to better and more optimal manifestation of the respective mental feature.
Such linear model of neuro-mental relationship does not conform to the data when conceiving results from across the divide of normal vs pathological states. Presenting various examples from recent research on neuroimaging show that only intermediate or average degrees in the expression of a neural mechanism lead to optimal, e.g., “normal” manifestation of the respective mental feature – “average is good”. In contrast, the data show that extremes at both ends, i.e., “too low” and “too high” degrees of the same neural mechanism lead to suboptimal, e.g., pathological” manifestation of the same mental feature. Together this corresponds to a non-linear model with an inverted U-shape relationship between neural mechanism and mental feature.

The thematic figure describes a putative model for the transformation of neural activity into mental features and its relation to mental disorders. For example, the frequencies of neural activity may be related to psychomotor speed. In healthy subjects (b), a ‘normal’ frequency range is likely to be associated with optimal psychomotor function. A slowing in neural frequencies would be associated with psychomotor retardation as seen in major depressive disorder, whereas faster neural frequencies would be associated with psychomotor excitation as seen in the manic phase of bipolar disorder. In this schema, temporo-spatial dynamics form the common currency between neural and mental features. Accordingly, a shift in neural dynamics will lead to a corresponding shift in mental features and thus to symptoms of various disorders.
Put in a nutshell, the inverted U-shape model entails that, concerning the degree of expression of the neural mechanism, “average is good, extremes are bad”. This provides a novel view of neuro-mental relationship which carries major implications for both neuroscience and neurology/psychiatry.
The non-linear inverted U-shape model allows connecting neural and mental features in a novel way, i.e., in terms of neuro-mental transformation, in the neuroscience of the healthy brain. At the same time, the inverted U-shape model enables us to understand both inter-individual variability and the normal-pathological continuum in psychiatry as an intrinsic (rather than extrinsic) feature of the brain’s way of processing neuro-mental relationships.