
When making decisions, data might not be overlooked, nor the methodology to collect and interprete them.
Especially in complex matteras as sustainability and circular economy, data, the collection and interpretation is key in helping our understanding and guiding our decisions.
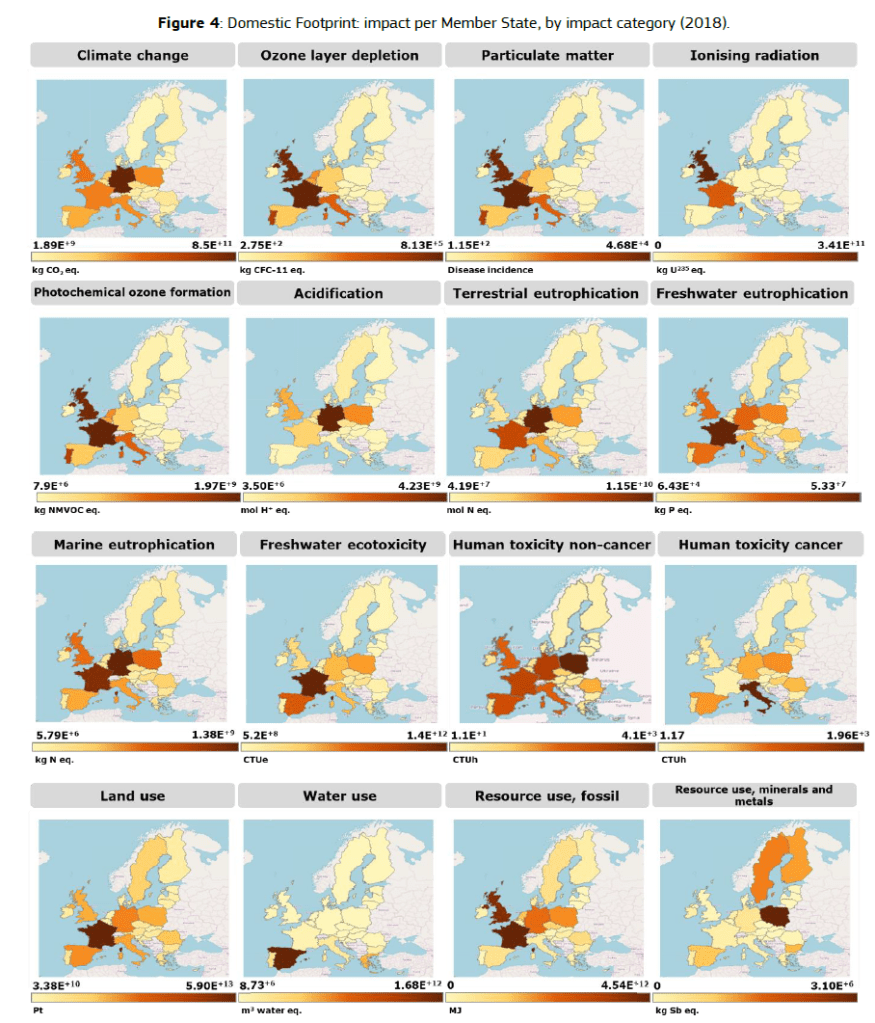
The EU JRC just published a great overview report on “Domestic Footprint of the EU and Member States: methodology and results (2010-2018)“. I can recommend it or the brievity and nice overview of a very complex topic, explained by its data and insights.

The report offers the insight on how complicated the simple notion of sustainability is composed by a great range and variety of measurements (and extrapolations or even best guesses), and how this wealth of data is mangeled into a comprehensible index for decision-making. The model used for ‘composing’ the index is standardised by the EU, but maybe not the only or the best one.
A detailed analysis of this indicator: Consumption Footprint Platform
https://eplca.jrc.ec.europa.eu/ConsumptionFootprintPlatform.html
A related recent article, “How robust is the circular economy in Europe? An ascendency analysis with Eurostat data between 2010 and 2018” builds on this complexity. The “technological boundaries” and “windows of efficiency” are introduced as new concepts. “Rebalance” is proposed as a principle to extend the waste hierarchy framework.
As an example of the complexity towards building a good data collection, a model and interpretation, I refer to the ‘Appendix A’ offering a “An indicative (and certainly not exhaustive) list of definitions and viewpoints of CE“
More interesting in this article is the discussion on what flows and what equilibrium between these flows are of interest and importance.
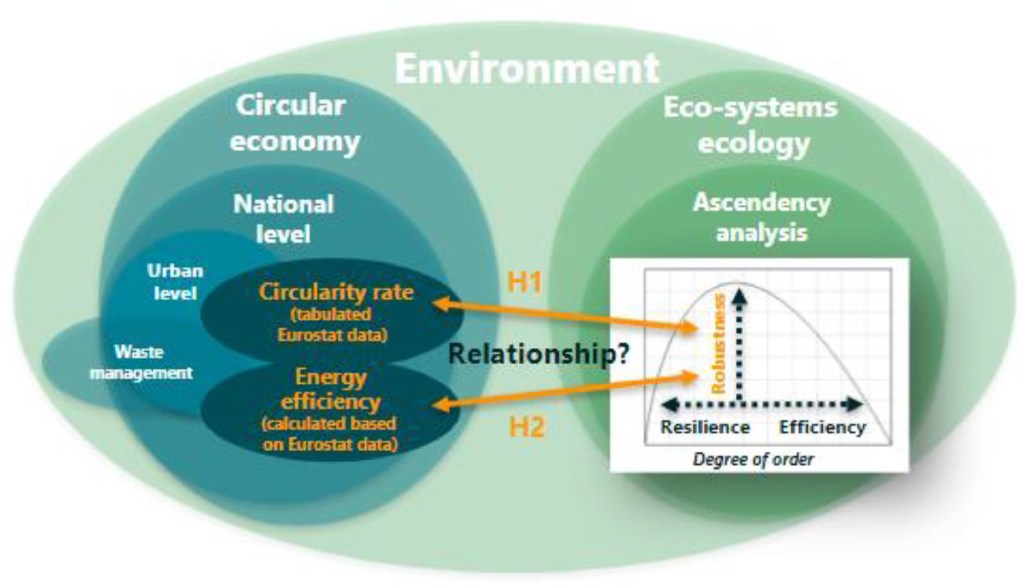
where H1 and H2 are the stated hypotheses.
H1o: Circularity rate is not related to the theoretical robustness of material
flow networks of the EU countries
H2o: Energy efficiency is not related to the theoretical robustness of energy
flow networks of the EU countries
As can be noticed in the figure, when the degree of order and the theoretical robustness are plotted against each other it is possible to construct a robustness curve and identify how far or close a given network is to the optimum state around which healthy natural ecosystems tend to balance.
This optimum state corresponds with the maximum robustness value of 0.368 and a degree of order of approximately 0.4 around which natural ecosystems tend to cluster (Ulanowicz, and Lietaer did some work on this).

The robustness curve is conspicuously tilted towards the left implying that in natural ecosystems redundancy is seemingly more important than efficiency.
It is also worth mentioning that Fath et al. (2019) stress that a change in the
values of the ascendency indicators “does not necessarily indicate a change in the health of an ecosystem, unless the metric change is caused by a decrease or extinction of several species producing small flows as opposed to a decrease in large flows (usually originating from bacteria, phytoplankton, or detritus).
However, the metrics serve to identify the changing state of a system. Whether a state change is detrimental or beneficial depends on the present state (e.g., natural, impacted), and on which flows caused the change in the metrics”.
The identified relationships between the average circularity rate (H1) and the average energy efficiency (H2) with the theoretical robustness of these material and energy flow networks […], respectively, suggest that ascendency analysis is a credible tool for supporting policy making.
Both on a national and on a local level for developing circular and robust urban waste management systems given data availability. The contribution to the underlying theory of ascendency analysis is the introduction of the concepts of “technological boundaries” and “windows of efficiency” of these human-made networks which are juxtaposed with the “window of vitality” that is often used to describe healthy natural ecosystems.

Ascendency analysis stems from the work of Ulanowicz whereby ascendency was defined as a non-conservative, macroscopic variable which natural ecosystems were hypothesized to optimize as self-organizing, dissipative systems. The method is grounded on information theory and the concept of entropy, and has been developed to assess the health (i.e. sustainability) of natural ecosystems with the concepts of resilience, efficiency, and robustness.
Within ascendency analysis, an ecosystem is abstracted into a network i.e. a group of interconnected nodes (e.g. trophic levels or species) where the links between them represent mutually constrained flows of a circulating medium such as matter or energy.
The concept of resilience refers to the network’s diversity and ability to withstand perturbations whereas efficiency in this context is related to its potential to streamline material and energy flows between its various species across trophic levels.
Both concepts are important and interdependent counterparts for the capacity of an ecosystem to develop since the “development of new adaptive repertoires requires a cache of what formerly appeared as redundant, inefficient, incoherent and dissipative processes [whereas] greater constrained and efficient functioning always generates increased dissipation”
Despite its limitations, […] ascendency analysis can be a highly relevant methodology for studying the robustness or sustainability.

3 responses to “Complex Data and Models lead to Ascendency Analysis”
[…] an earlier post, I already mentioned the work of Ulanowicz whereby the “window of viability” & […]
LikeLike
[…] learn to engineer without “our darlings”, and open our thinking and design to the health (i.e. sustainability) of the solution, comparable to these of natural ecosystems with the concepts of resilience, efficiency, […]
LikeLike
[…] van het aanpassingsvermogen van ecosystemen leren ons de risico’s van faling door onbeslistheid of rigiditeit, ten gevolge van de verkeerde evenwichten tussen veerkracht en […]
LikeLike